What is this book about
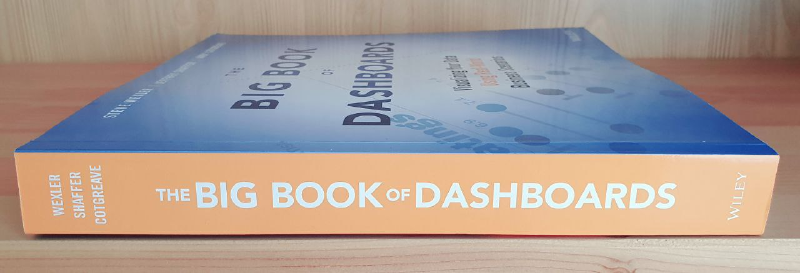
If you are a BI developer or designer and have never read “The Big Book of Dashboards: Visualizing Your Data Using Real-World Business Scenarios” you should definitely correct this oversight. It is a must-read for anyone involved in dashboard design or data visualization.
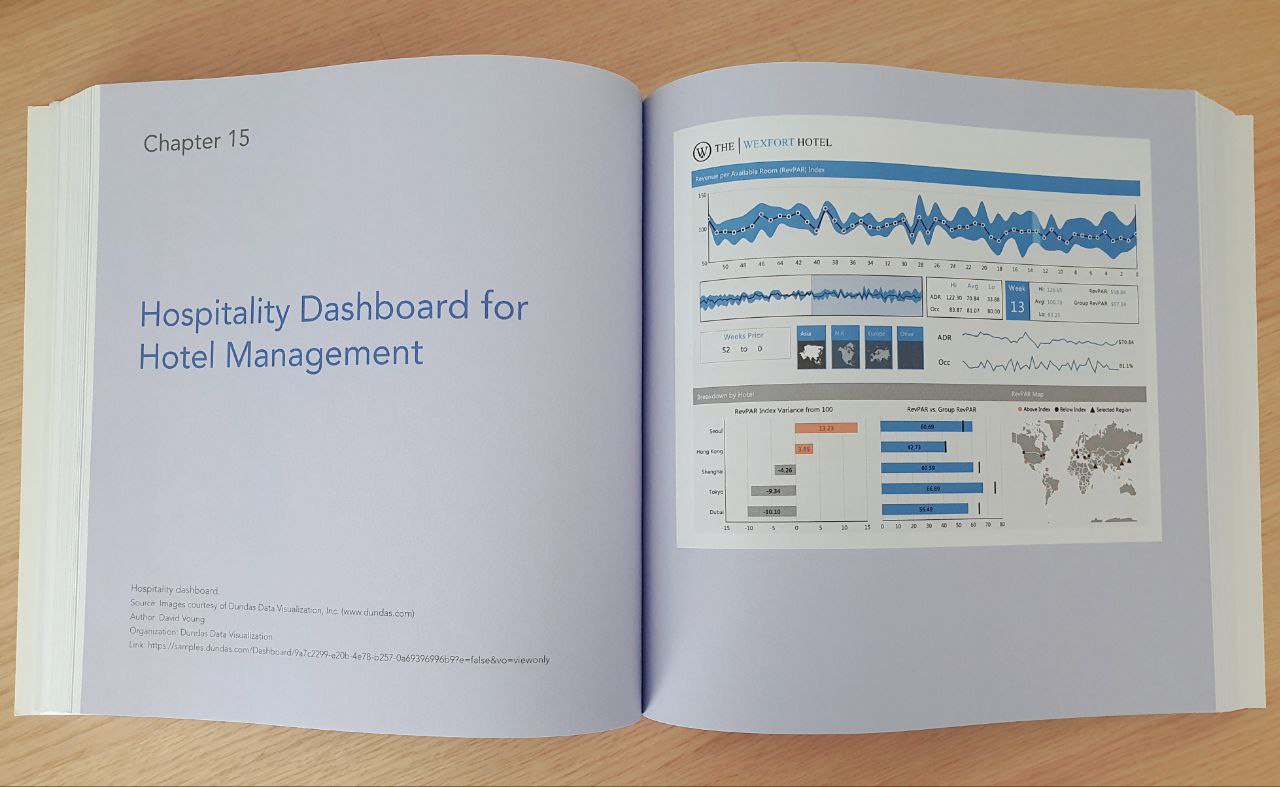
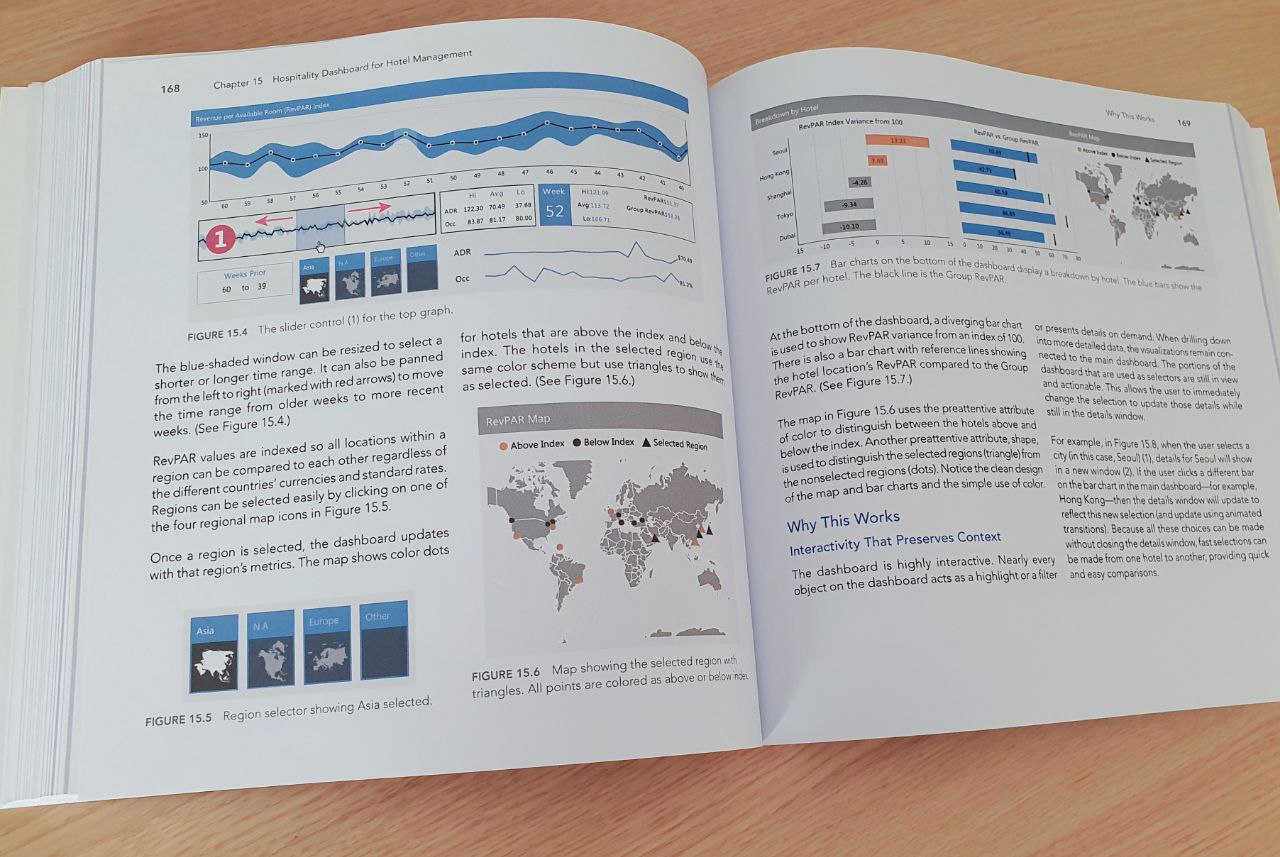
Each chapter is packed with real-world business scenarios, offering a detailed description of the case, a pre-made dashboard, and comprehensive explanations for each element. Throughout the book, the authors emphasize the importance of understanding the needs of end users and tailoring dashboard designs to effectively communicate insights. Drawing on their extensive experience in the field, they provide guidance on data visualization best practices, including chart selection, color usage, and layout design.


Personal Reflection
As a newbie to dashboard development, I found this book very useful. It’s not a textbook where you can find all aspects of dashboard design; rather, it’s a practical guide that you can apply directly to your daily work. You can reuse some dashboards from it or find inspiration for your own unique designs.
The dashboards in this book were crafted using Tableau, making it somewhat challenging to replicate the same visuals in Power BI. However, I came across dashboard templates for Power BI inspired by this book on some BI developer’s website. It’s worth noting that these templates are not free and I haven’t tested them.
I highly recommend this book to anyone looking to unlock the full potential of their data through effective visualization techniques.
